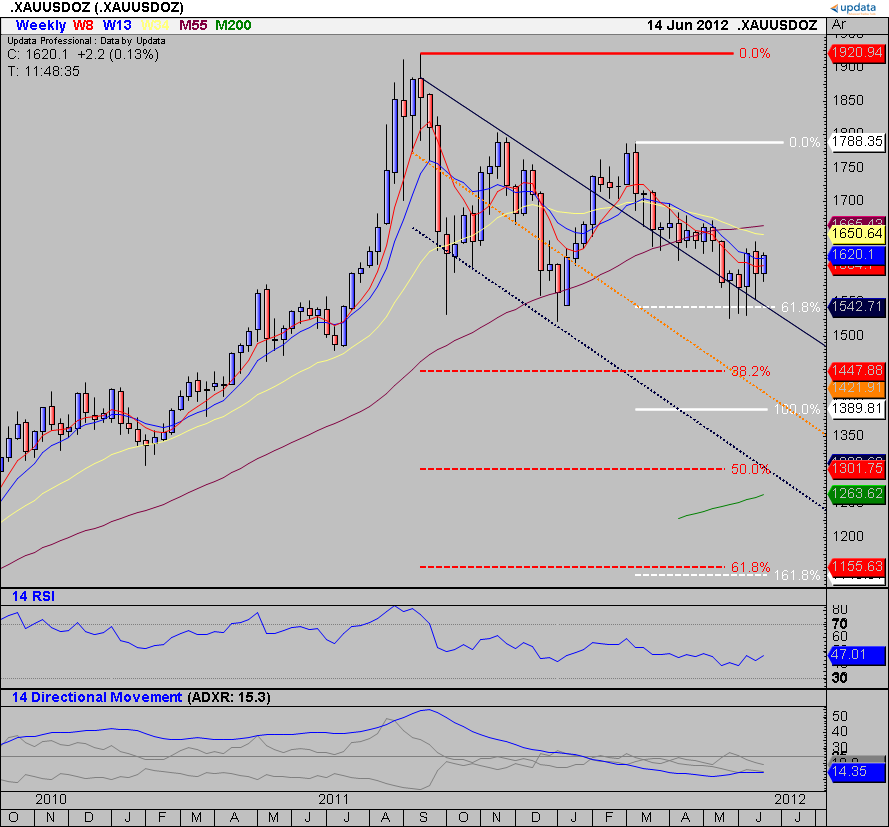
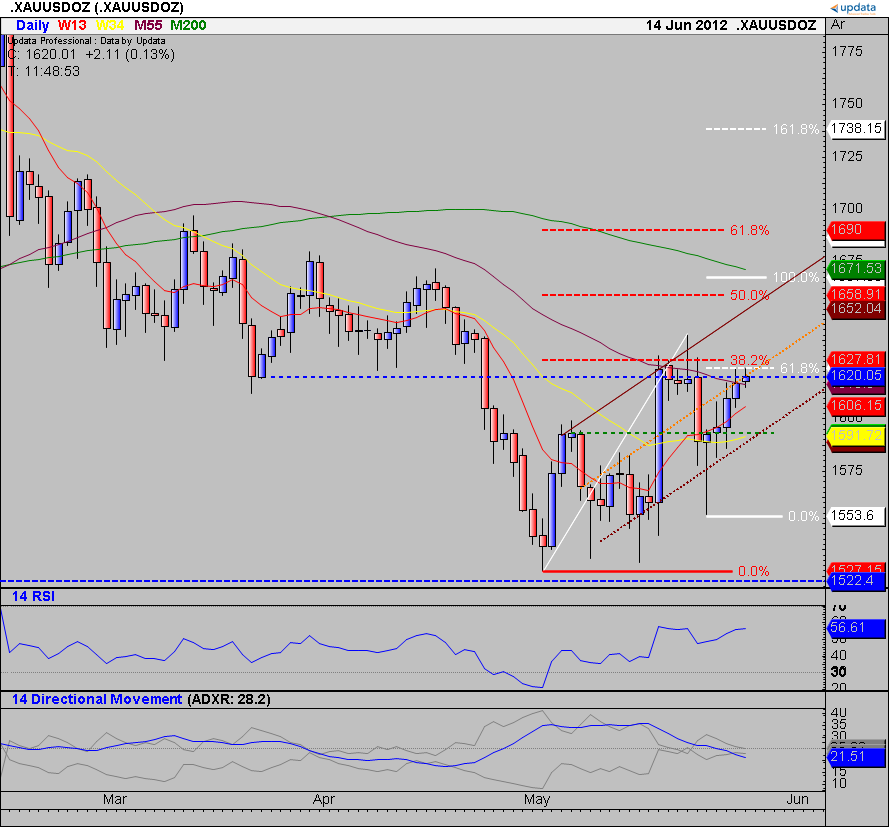
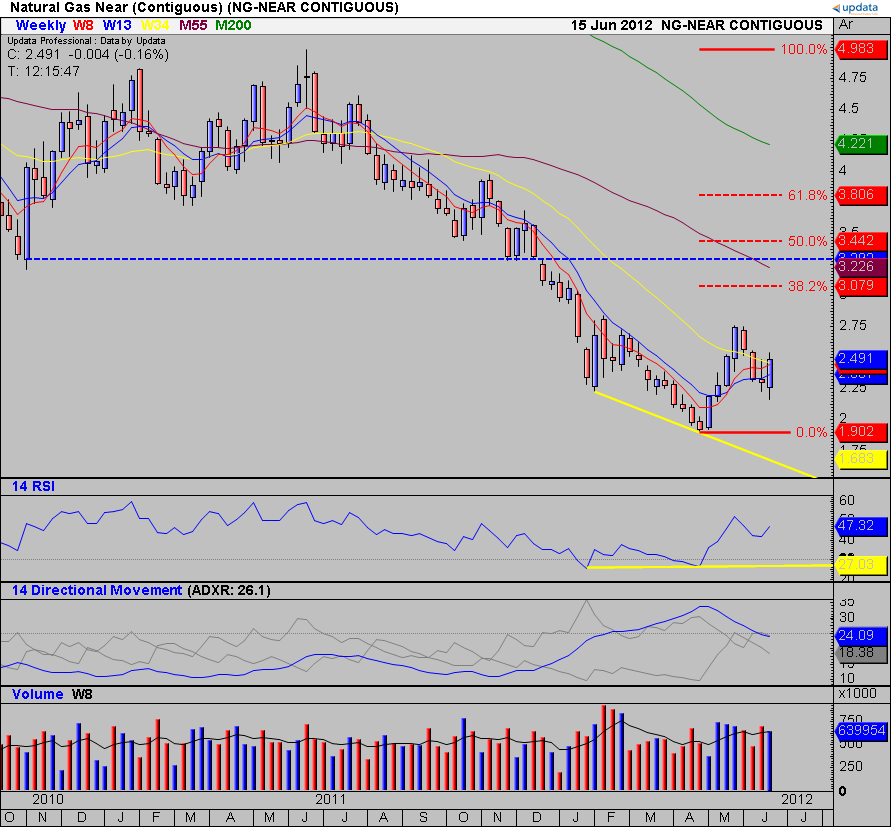
However, yesterday's storage data release was the catalyst for a rally off the deeper Fib 0.618 retrace level. At the time of writing this week looks like being a bullish engulfing, outside up week.
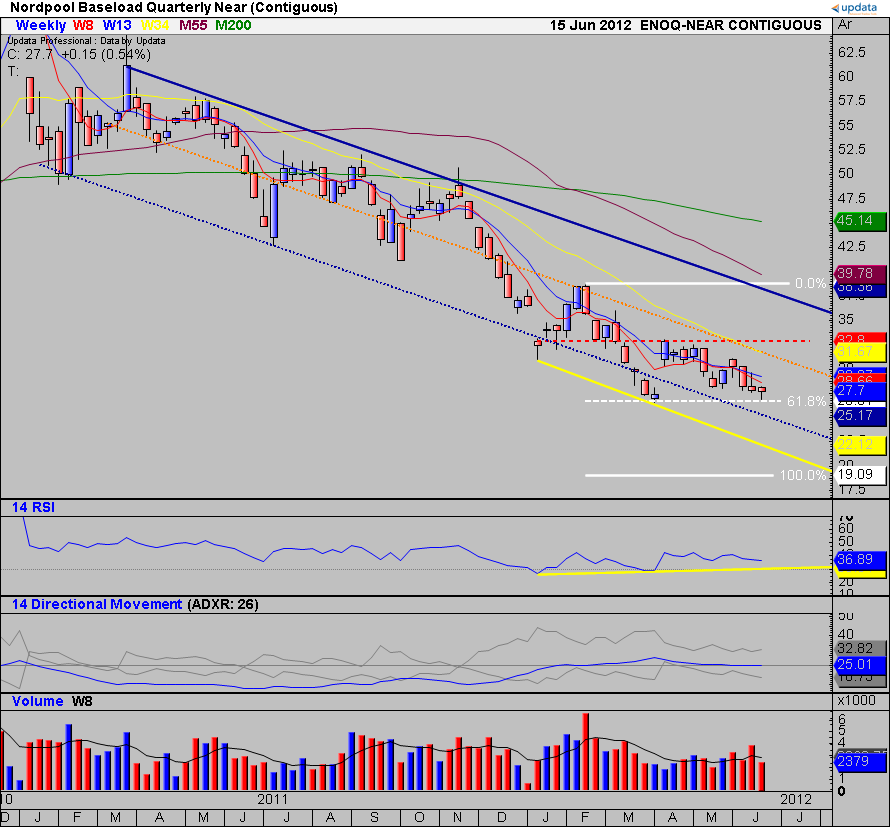
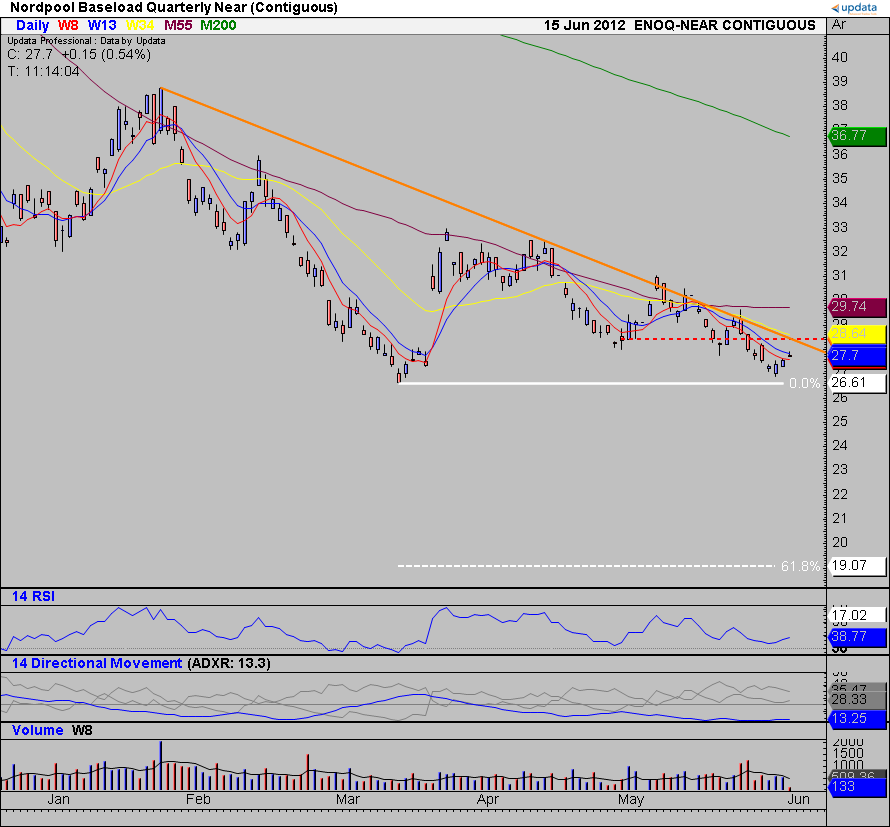
Yesterday was a powerful reversal day, making a new low for the move only to then take out several days' highs in one session on very high volume. The low of that session is key support now as it looks like the correction off 2.759 is now over. Possible targets from here, should the 2.759 be traded over, include the 100% extension level at 3.033 (white solid line) or the 1.618 extension level at 3.563 (white dashed line.) Should price rally over 2.759, it would look like an inverse head and shoulders, with a target level of 3.616 (black dashed line.)
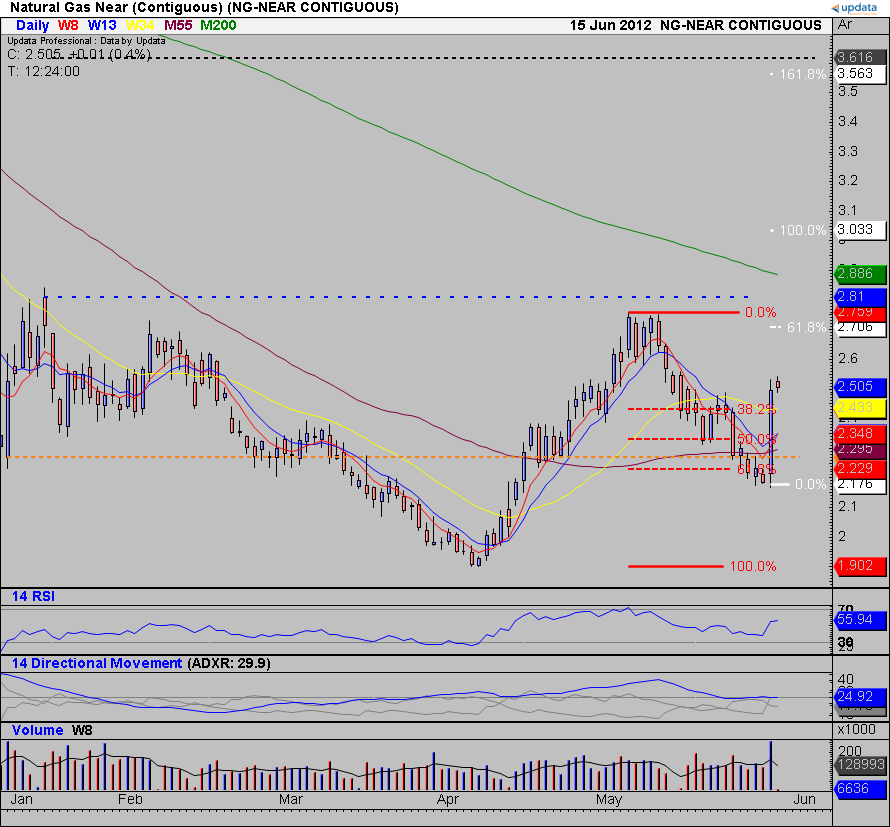
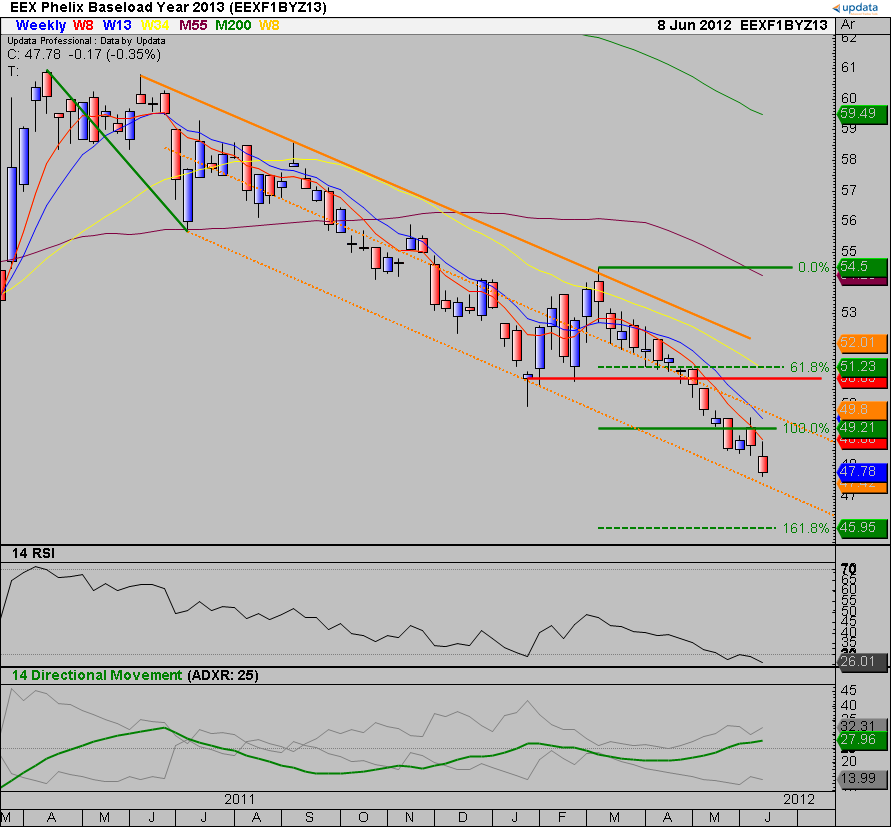
Charts supplied by Updata for Energy Traders.